Analysis
Use this video for a visual overview on how to import data into analysis and use it:
Analysis is done through Power BI. You can download it for free here.
To analyze the CSV data you downloaded at Parsing Data you must download the Power BI file in this repository. Once downloaded, put the
pbixfile into an empty folder.Next put you CSV file into the same folder as the
pbixfile. Rename it toVScouterData.csvOpen the
pbixfile with Power BI. To use this new data clickTransform Dataand thendataFolderPath. On this page change the directory to where thepbixfile and CSV file are located (ex.C:\Users\username\Documents\Analysis). There should not be a\at the end.Click
Close & Apply.
Analysis Pages
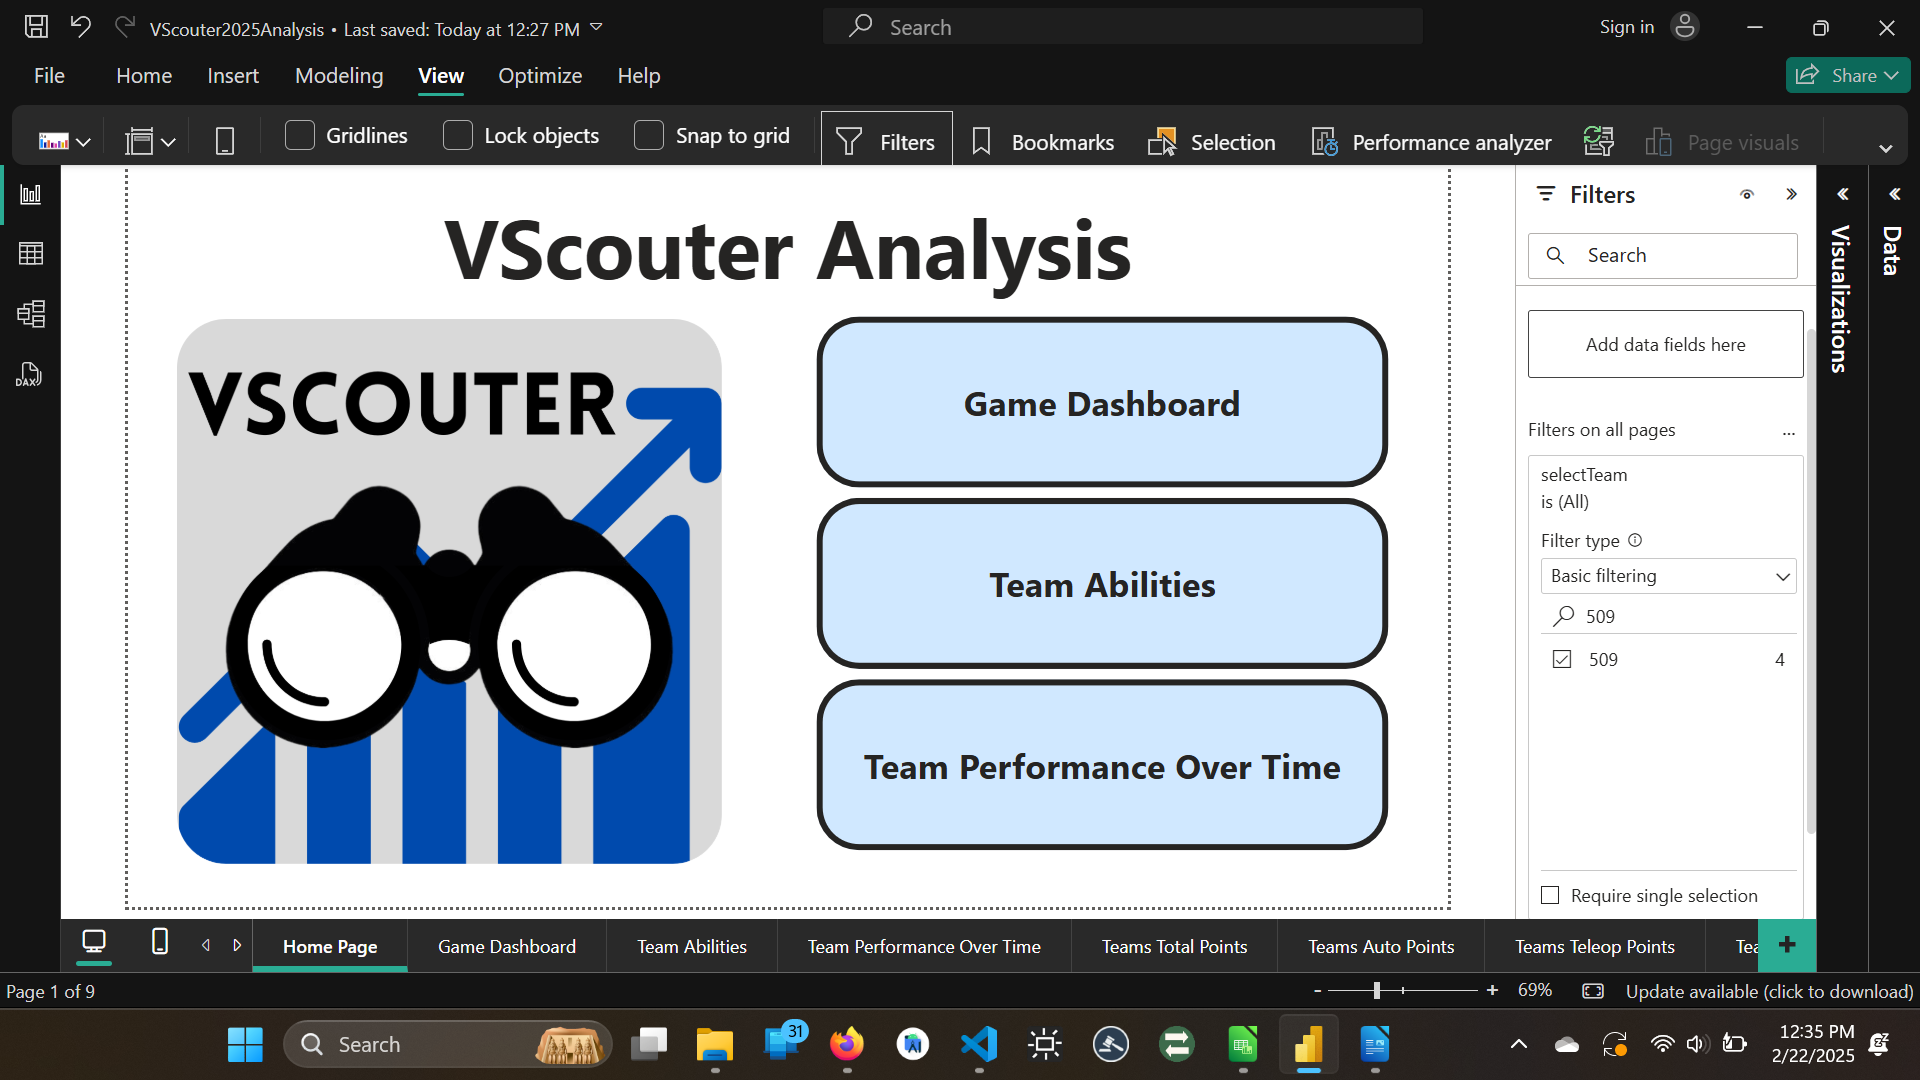
Home Page: This is the home page where you can go to the other analysis pages easily. To click on the buttons, you press
ctrl+click.
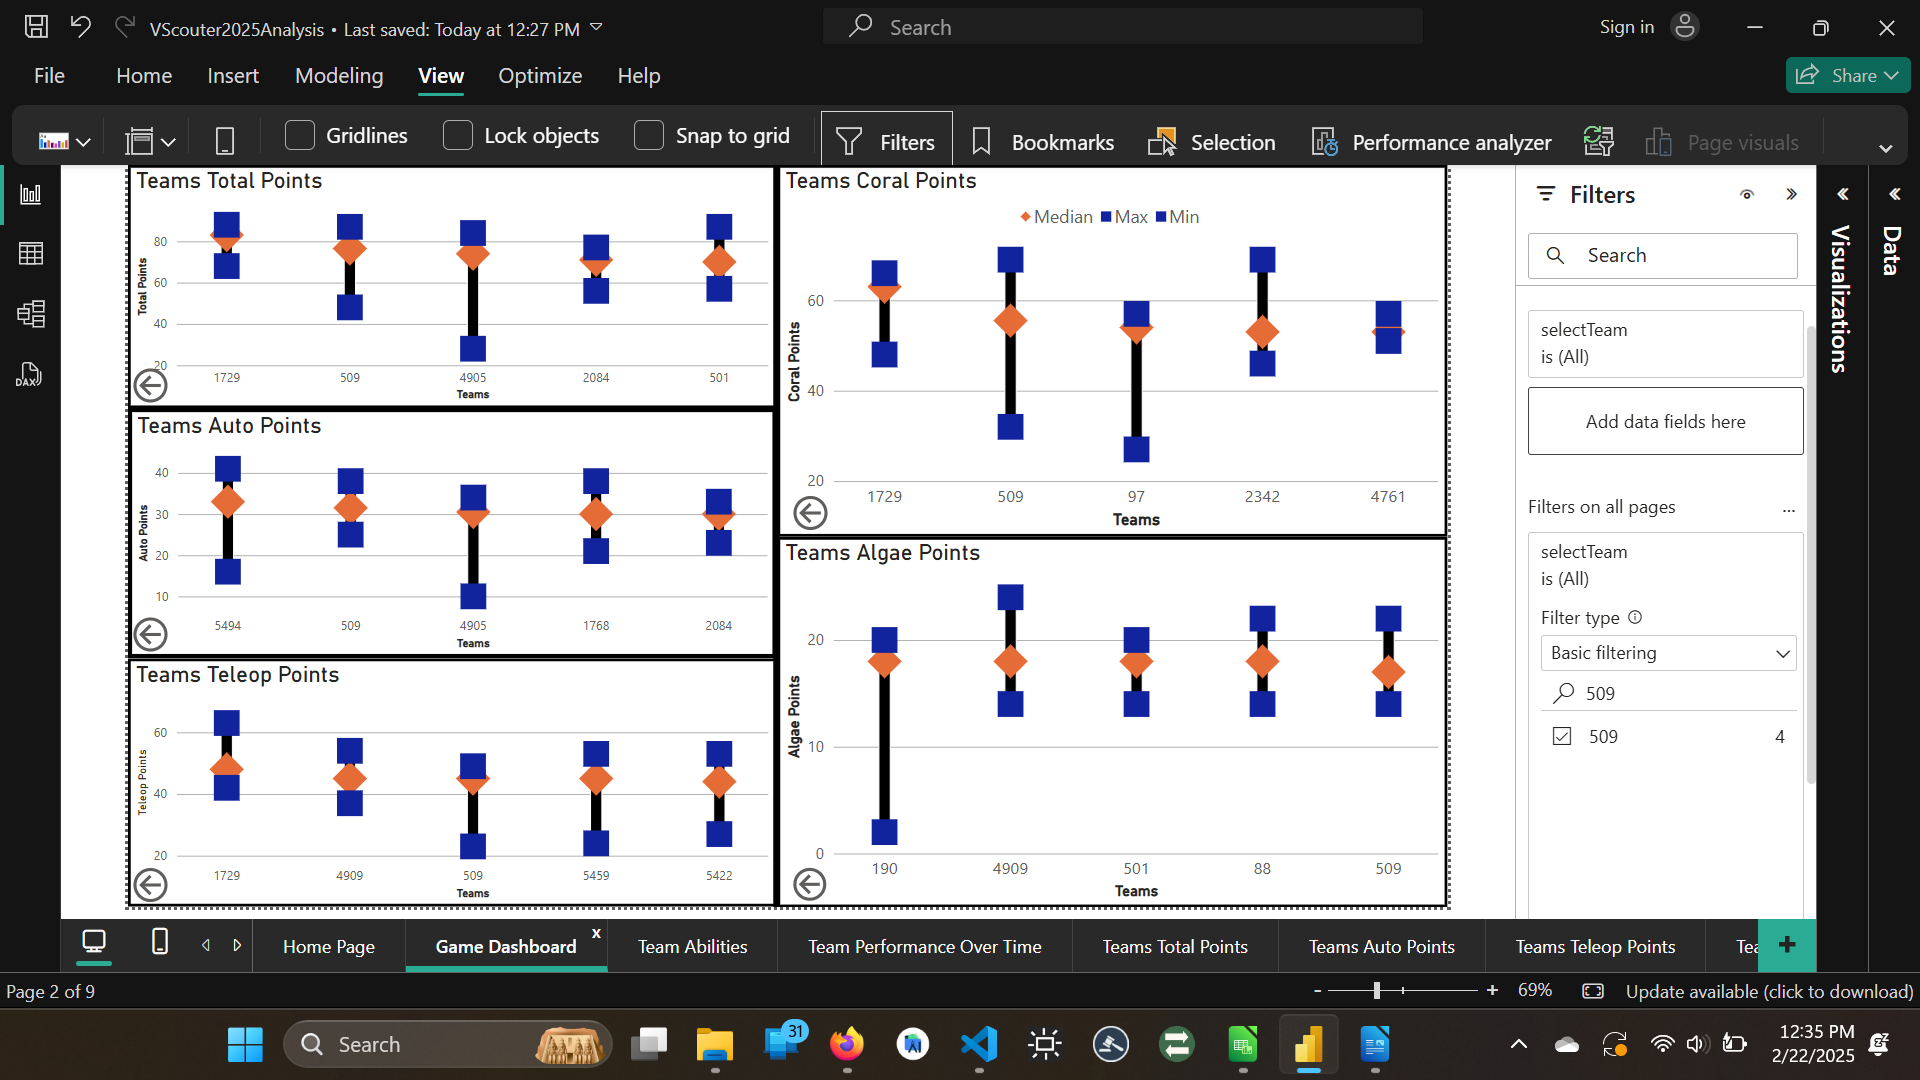
Game Dashboard: On this page you can look the max, min, and medians of each team in total points, auto points, teleop points, coral points, and algae points. The top 5 are shown on this page. Clicking the arrow next to each graph will bring you to a specific page to it so you can see all of the teams. During alliance selection, if a team is picked and you do not want to see their statistics, you can click the
Filterpanel to open it and filter the team out of theselectTeamfilter in theFilters on all pagessection.
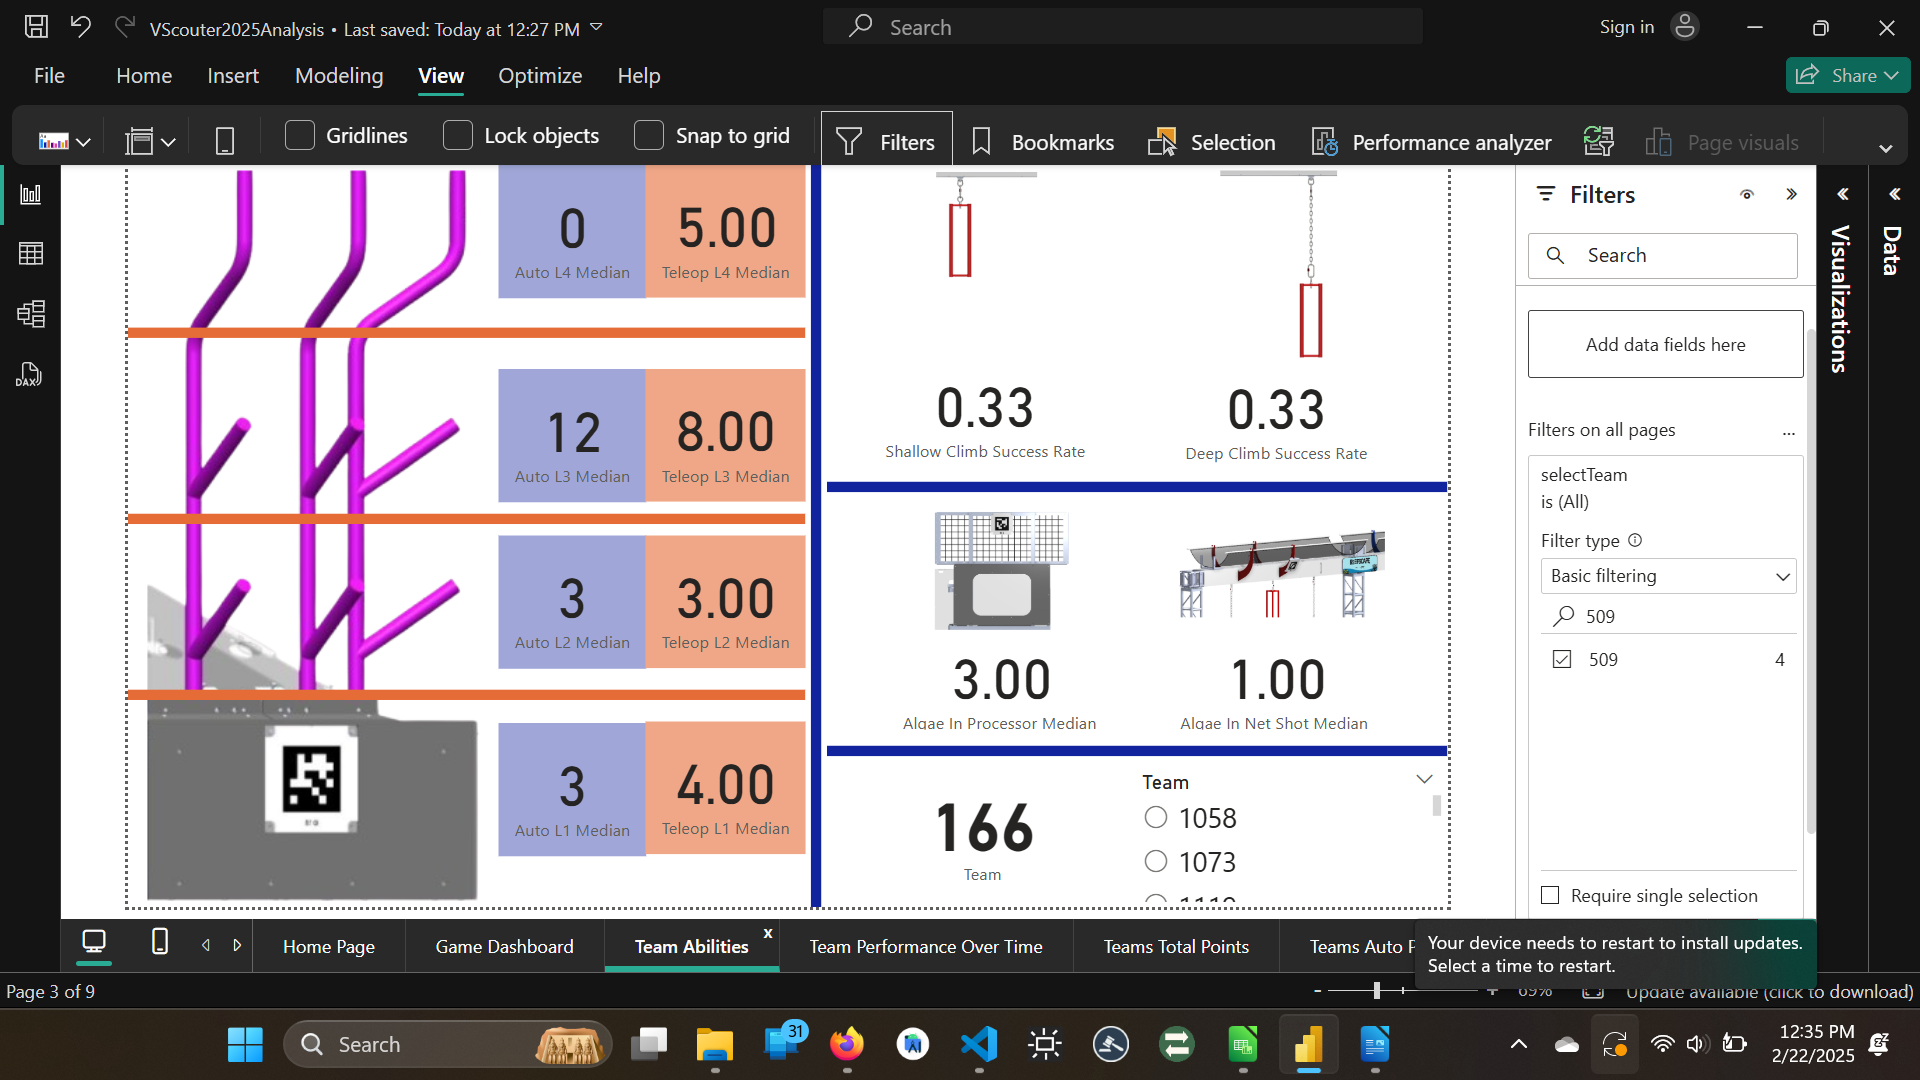
Team Abilities: Here you can see a teams overall data. To change the team selected, you can use the list selection.
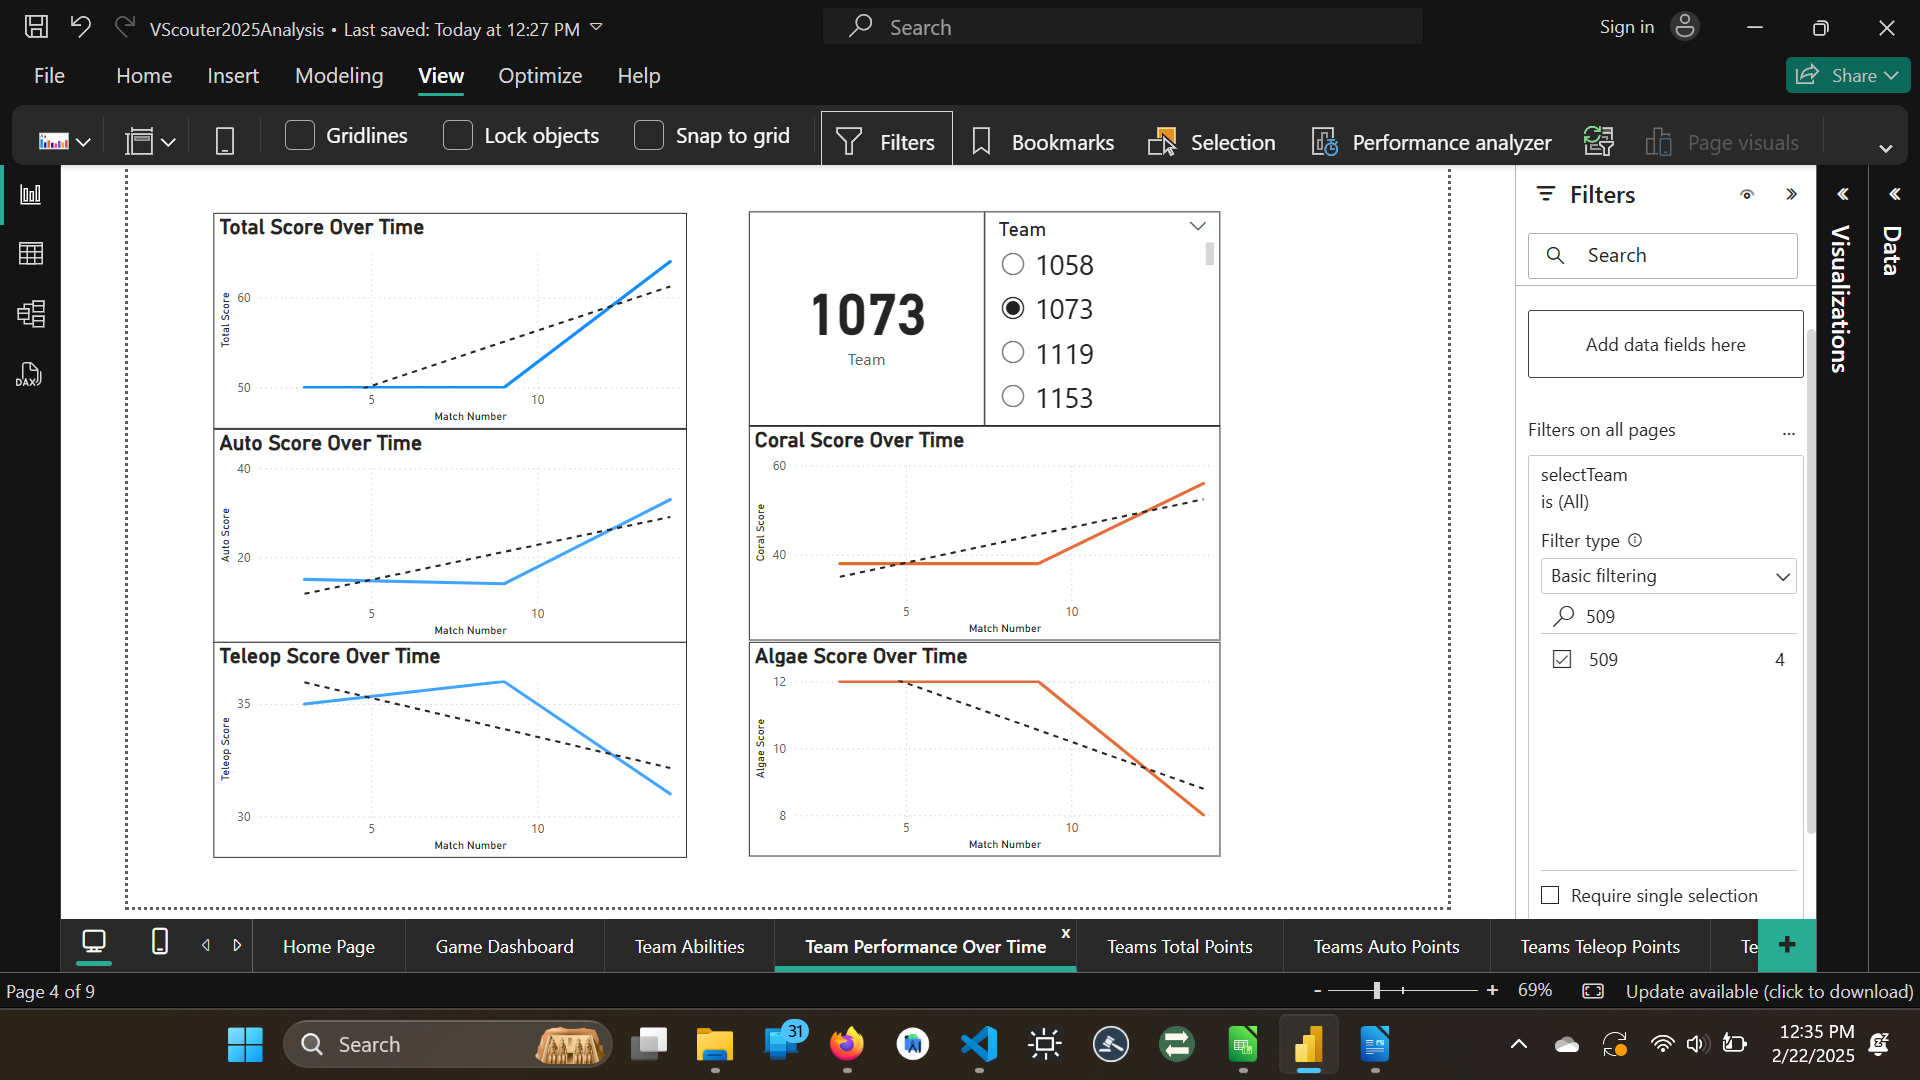
Team Performance Over Time: On this page you can see a teams performance over their matches played. This is scene in 5 graphs: total points, auto points, teleop points, algae points, and coral points. To change the team selected, you can use the list selection.
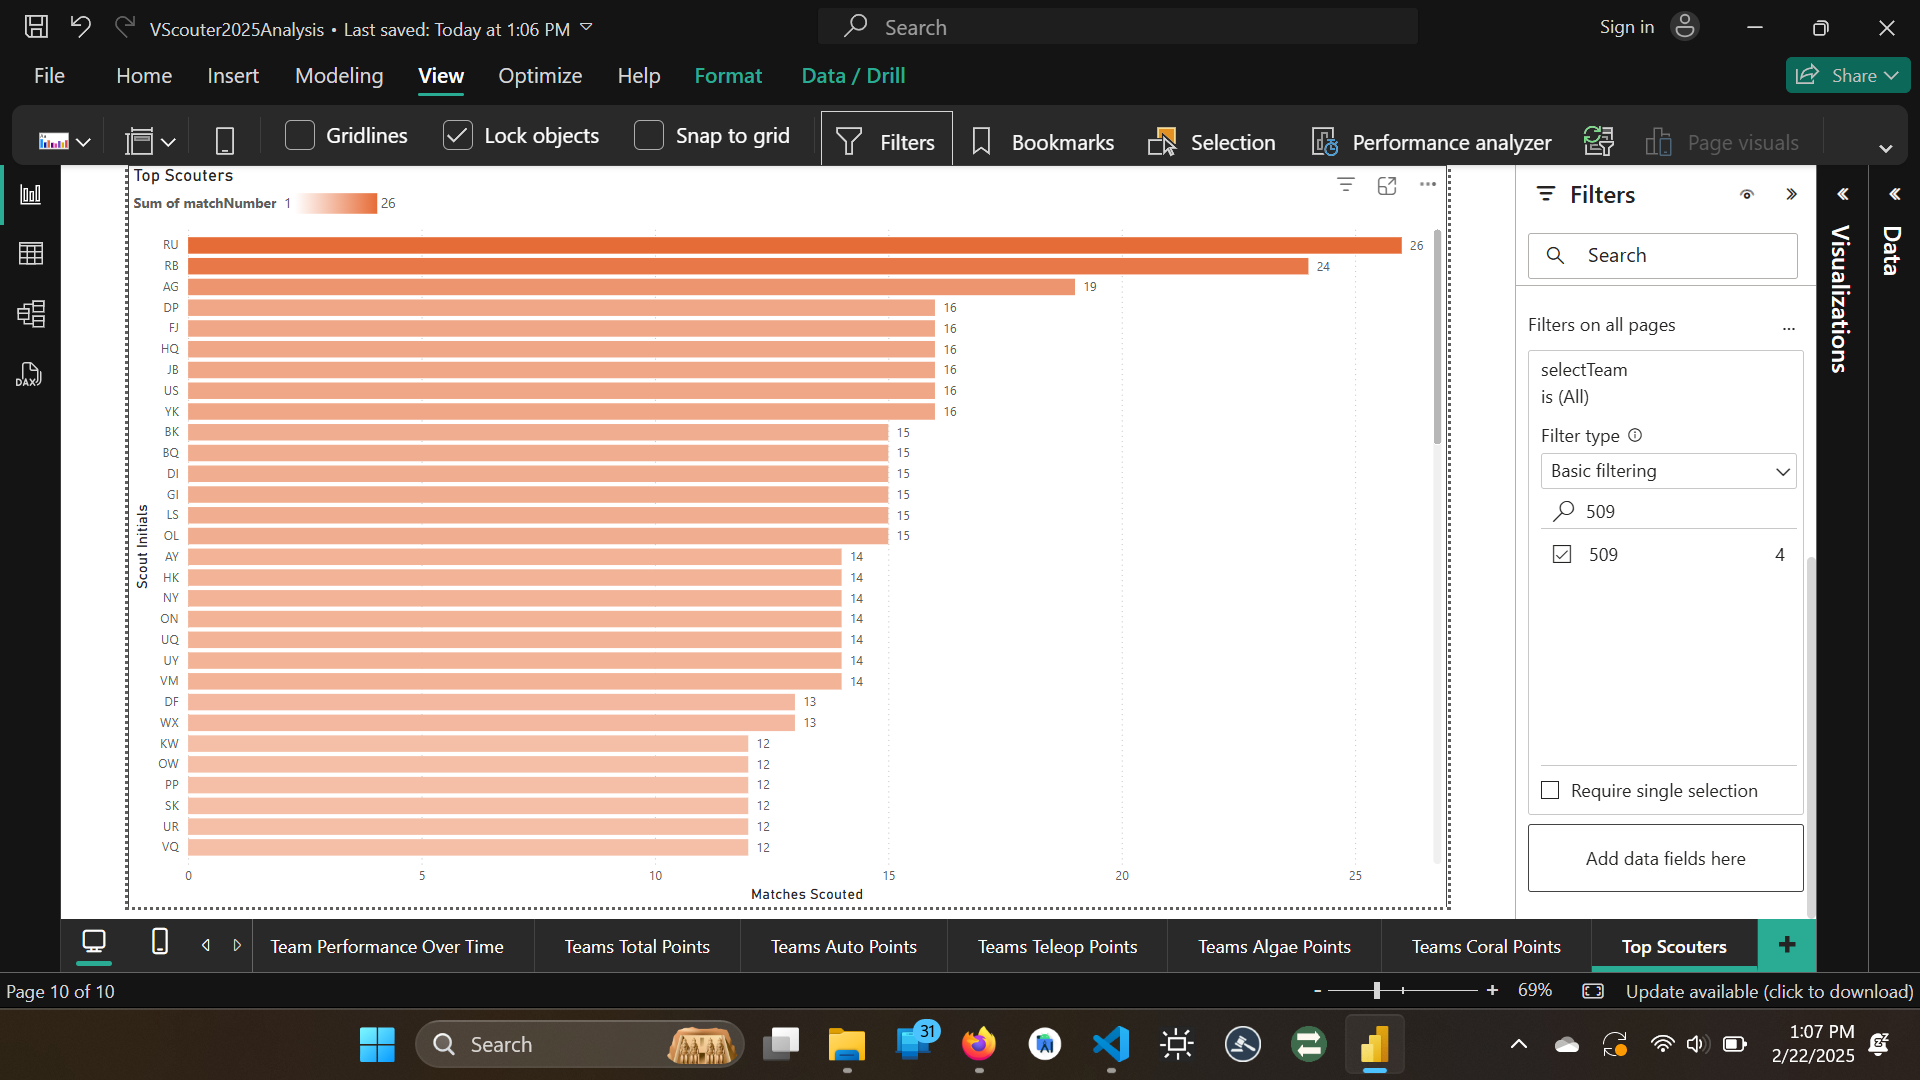
Scouter Match Numbers: On this page you can see how many matches a scouter has scouted. This is shown by a graph of each scouter initial and how many matches they have scouted.